Analysing top customer trends for Brazilian e-commerce
Goal
The Olist store is a Brazilian e-commerce marketplace founded in 2015. As part of its services, the marketplace provides merchants to way to manage product listings and store payments. A key operational objective for Olist, is for new merchants to be able to create a virtual product showcase on their site “in less than 3 minutes”. Whilst offering payment checkout tools and integration with logistics operators. I worked as part of a 6 person DA team with the goal of providing location, delivery, sales promotion, and product category insights; that the firm can utilise in its upcoming growth strategy review. Deliverables for this project included a professional dashboard with an overview of KPI metrics related to actionable insights. As well as a report view for full insights relating to each hypothesis assessed in the analysis. My area of responsibility within the team was to assess insights for top customer sales performance based on the 2 years’ worth of transactional data and provide recommendations to boost sales growth.
Duration
The project duration was 3 working days, utilising the existing OLIST dataset for financial years 2017 and 2018. Our team utilised a Scrum format to efficiently establish initial findings and provide timed feedback to successfully finalise our deliverables before the 3-day deadline. A key consideration of the project was ensuring the data accuracy and cleanliness to schedule time available for analysis work.
Dataset overview
The Olist dataset has information of 100k orders from 2016 to 2018 made at the marketplace in Brazil. The data model allows viewing from multiple dimensions: from order status, price, payment and freight performance to customer location, product attributes and finally reviews written by customers.
Analysis Approach
The initial step of the analysis process was to identify key area of interest in the dataset that would help procure meaningful insights for the firm. Through the Powerbi model viewer, relationships between fields in data tables were established based on the imported data schema. As my purview related to top customers, It was important to identify fields in ‘olist_orders’, ‘olist_order_items’ and ‘olist_customers’ data tables; that would allow procuring insights relating to sales by unique customer ID, product category and regionality. A specific challenge faced in the analysis phase was ensuring that data pertaining to the aforementioned tables could be evaluated in terms of year-on-year performance. This was vital to our team’s effort assessing variables and trends affecting sales growth; to inform the upcoming Olist growth review. To achieve this, it was necessary to utilise the power query service to establish custom columns that would account for the specific financial year of each sale made on the marketplace. As well as, set up new measures to provide useful analysis in terms of percentage change of key variables between financial years.
Result/ findings

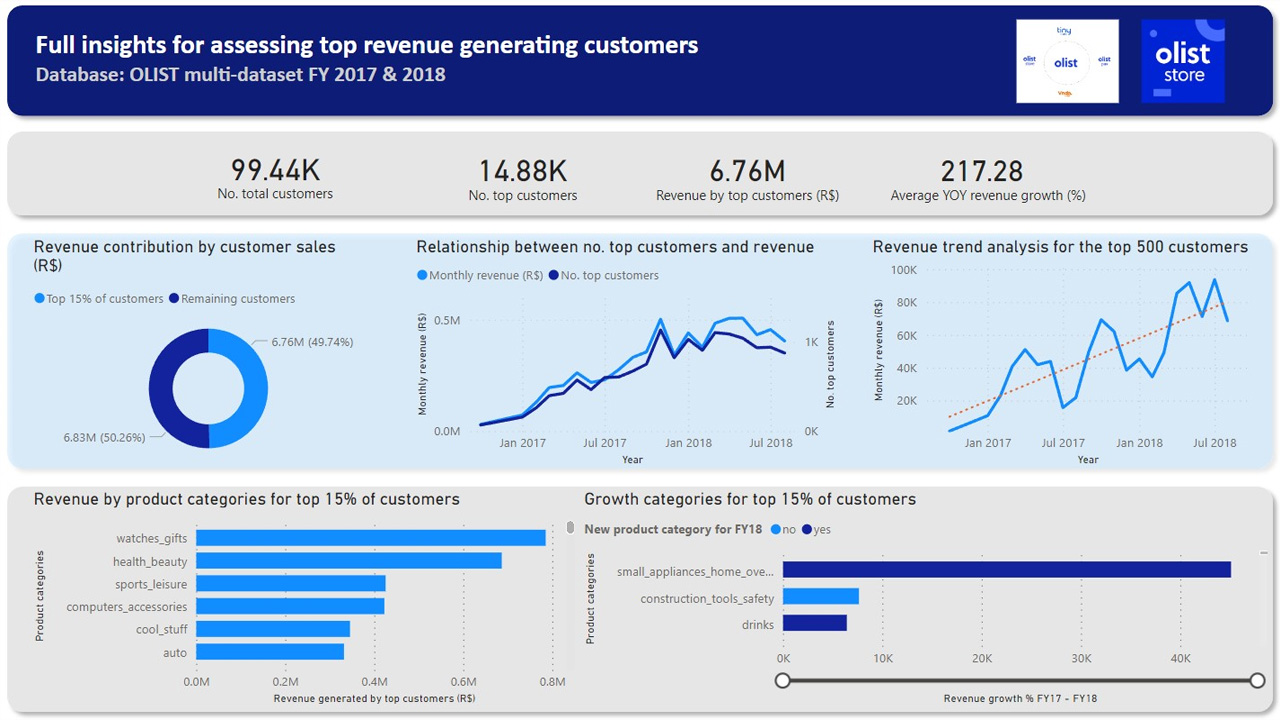
Fig. 1 PowerBi report for top customer insights
'
Please click here to view my presentation in Youtube.
