Analytical study of employee numbers and store size with respect to annual revenue
Goal
Adventureworks executive leadership was presenting results to the Board and asked our DA team to provide data, including global annual sales volume by regionality, revenue, and team performance insights in relation to revenue.
As part of a trainee DA team, my role was to procure insights relating to the relationship between employee numbers, store size with annual revenue.
Deliverables for this project includes documented source code for statistical and graph analysis, a professional dashboard displaying key metrics, and an evaluated board presentation to present our DA team findings.
Duration
The project duration was 2 working days, utilising the existing ‘Adventureworks2019’ database data and structure. It was important that the sourced data was available, clean and complete; to ensure that project objectives could be carried out by our submission deadline.
Dataset Overview
Microsoft’s Adventureworks2019 has a well-structured database schema that represents various aspects of the business, including sales, products, human resources, customers, and production. The dataset has been evaluated to be ‘clean’ prior to analysis work, with no missing information and inconsistent field data types.
Analysis Approach
To gain a strong understanding of the data relationship between employee numbers, store size and annual revenue:
The initial step was to use SQL server to identify useful fields for analysis. Creating queries to join previously identified fields between relational tables, as well as including filters and metrics that proved useful for assesing Adventureworks store performance in relation to revenue. An important consideration throughout this process was selecting data in fields between tables that were directly comparable in terms of date or store type to ensure useful and relevant findings.
Python libraries Pandas, Matplotlib and Seaborn were utilised to analyse the data queried on SQL. Overall trends and specific performance metrics were assessed utilising customised correlation heatmapping, scatter plots and histograms.
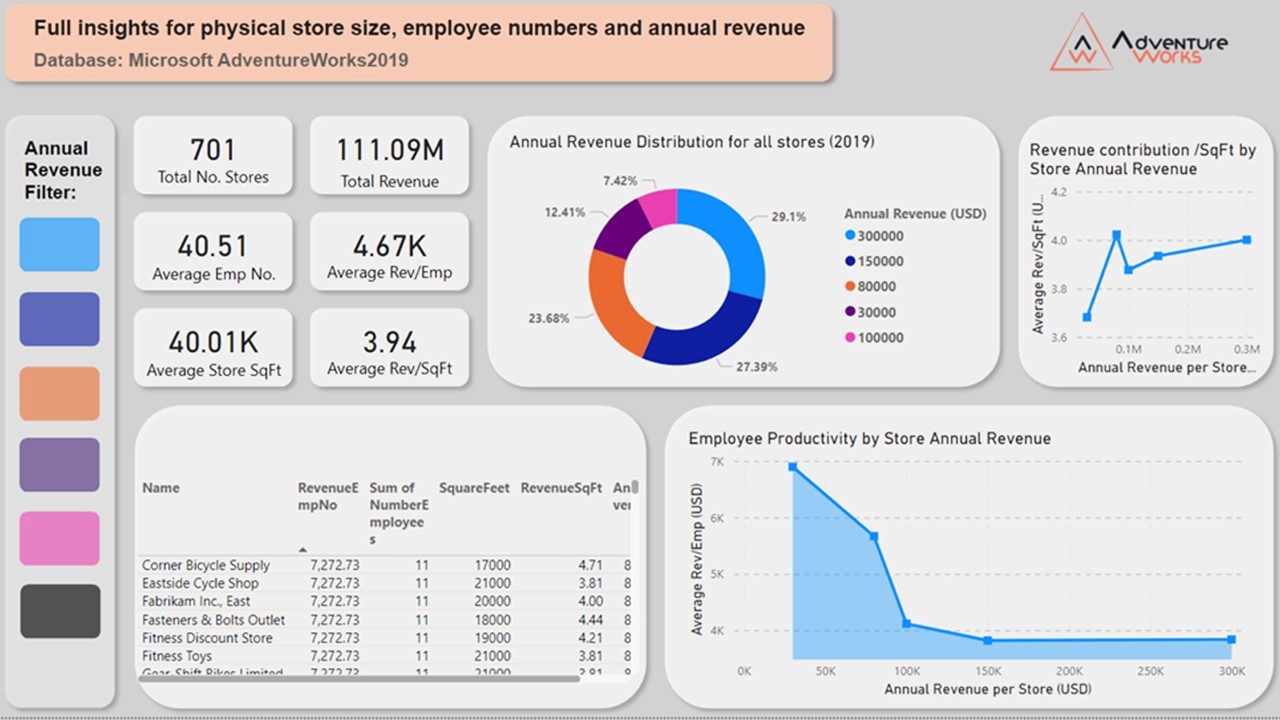
I also developed an interactive PowerBI view as part of the DA team presentation deck, to provide accessible insights to stakeholders on our findings for the AdventureWorks2019 database.
Result/ findings

Please access my Github to view the full documents.
